What a technician productivity formula actually measures
There is no single technician productivity formula. When an owner and his manager argue about whether a technician is productive, they are usually each holding a different ratio. This article uses three: utilization, efficiency and revenue per hour. They are the definitions used here, not a standard handed down by any outside body.
Each one answers a different question about one technician. Utilization asks how much of the paid day was billable. Efficiency asks how long the work took against how long it should have taken. Revenue per hour asks what the hour earned. A technician can score well on one and badly on another, which is why quoting a single number settles nothing.
Field-service software lists the same words as performance indicators. Whatever the dashboard calls them, the test is the same. Each metric measures one thing, and you should be able to say which thing before you act on it.
Hold every number to one standard: can you reproduce it from your own timesheets and invoices? A figure you can rebuild by hand beats a score on a screen that you cannot trace back. If you can't reproduce it, you can't defend it to a technician who disputes it.
That is our editorial position. A technician's number that nobody can check turns into an argument about the person. A number you can check turns into an argument about the work.
Each one answers a different question about one technician.
The formulas: utilization, efficiency and revenue per hour
Here is each calculation with its inputs, so you can run it on one technician from your own records this week.
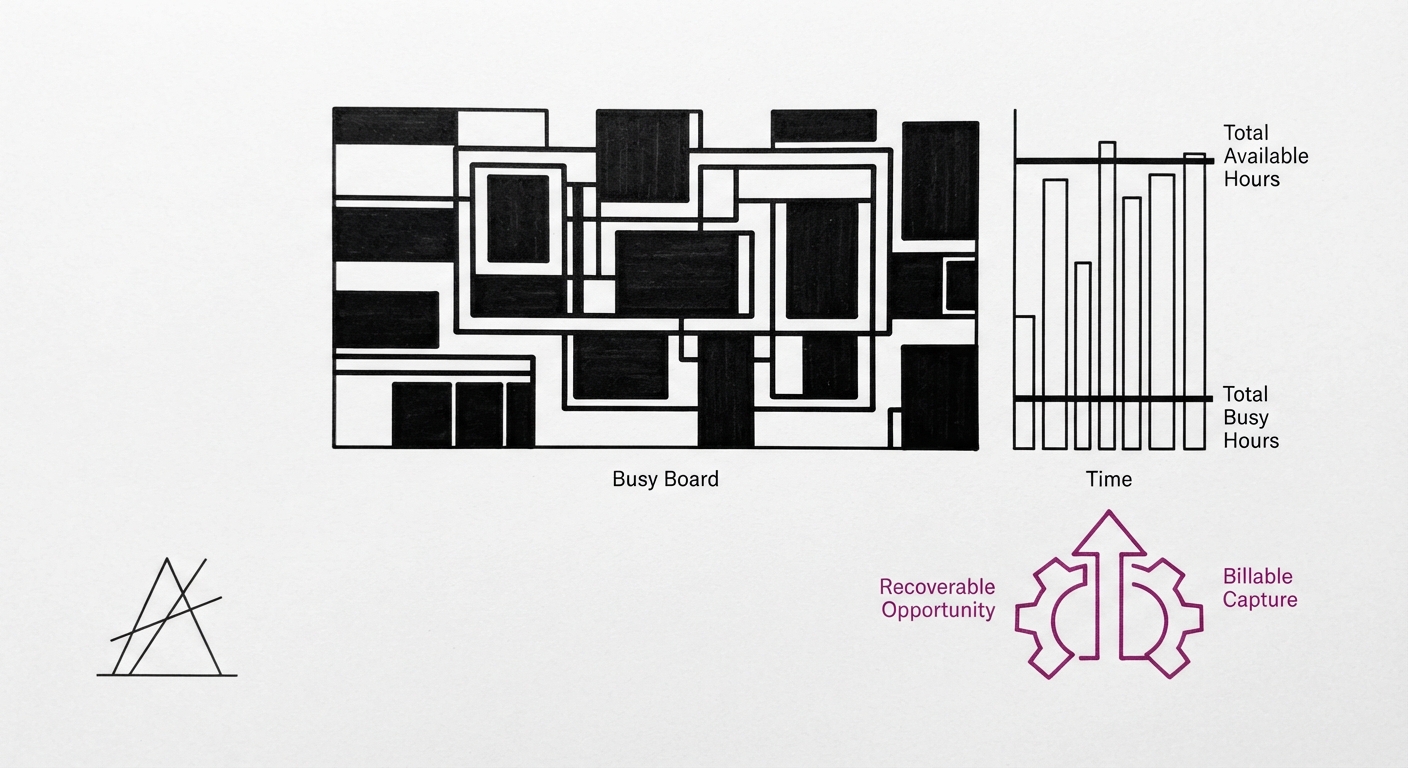
Utilization is billable hours divided by hours worked, the paid hours, shown as a percentage of a technician's day. Billable hours are time spent on customer work you charge for. Time the customer does not pay for, such as shop time, training, restocking and waiting on a callback from the office, stays in the denominator but not the numerator. That is the point of the ratio: it shows how much of the paid day reached an invoice.
Efficiency is the hours the job was expected to take, or the hours billed, divided by the hours actually spent on it. Say plainly which version your shop uses. A flat-rate shop compares flat-rate hours billed against the clock. An hourly shop compares an estimate against the clock. The same job gives different answers under the two, so pick one and keep it for everyone.
Revenue per technician hour is the revenue from that technician's completed work divided by hours worked. Put it next to utilization. A technician with high utilization and low revenue per hour is busy but underpricing, or stuck on low-value calls.
Here is a hypothetical week, an arithmetic illustration and not a client result or a benchmark. A technician is paid for 40 work hours. Of those, 28 are spent on customer jobs. Those jobs were expected to take 24 hours in total. The technician completed work worth $4,200.
Utilization is 28 divided by 40, or 70 percent. Efficiency is 24 divided by 28, or about 86 percent. Revenue per hour worked is $4,200 divided by 40, or $105. Read together, the technician spent most of the day on jobs but took longer than expected on them, and the hour earned $105 of the $150 it would earn if every paid hour were billable.
Calculate per technician first and aggregate across technicians only afterwards. Our own audit methodology compares technicians on like-for-like work, service against install, because an average hides the spread that matters. A shop-wide average time per job can look healthy while one technician is far above it and another far below.
We state no industry benchmark percentage here. We have none from a named publisher, and a number with no source would only give you something to chase. Use your own technicians' history as the comparison, and measure change from your own starting point.
Where the hours go: drive time, idle time and the board
Low utilization is usually a scheduling and routing problem before it is a technician problem. Before you talk to anyone about effort, find out where the paid hours went.
Our own audit methodology splits a technician's paid day into on-site time, drive time and idle time. That split is a method for looking, not a result. The gap between hours worked and billable hours usually sits in the last two.
Travel time between service calls is set by how the work orders were sequenced. That makes it a dispatch decision. A technician cannot fix it from the truck, and an efficient technician sent across town twice in one morning will still show poor throughput.
Buffer matters in both directions. A schedule with no buffer produces late starts, and one late job pushes the rest of the day. A schedule with too much produces idle time. To see which you have, compare job completion times against what was booked, job by job, for a few weeks.
Where workload is uneven across technicians, look at who gets which calls. The cause is usually in the assignment, which points to a bottleneck in dispatch, not in the field. One technician gets the long, mixed calls while another gets compact ones, and the ratios follow.
If the board is where the hours leak, the fix is in how calls are sequenced and how gaps are filled. Our plumbing dispatch article on dispatching strategies and scheduling efficiency covers how to sequence calls and reduce idle time. The same logic carries over to other trades, since they all depend on the same board.
Low utilization is usually a scheduling and routing problem before it is a technician problem.
Callbacks, parts and the work that gets billed twice
Callbacks and missing parts quietly cut efficiency, because the same job takes two visits and one is often unpaid.
A callback is a return visit for work already billed. Count callbacks per technician as a share of completed jobs, and record the cause on each: workmanship, wrong diagnosis or missing part. That counting method is ours. We claim no result from it, only that the cause column is what makes the count useful.
Many callbacks are parts problems. The right parts were not on the truck, so the job split into two visits. The first visit used drive time and on-site time and billed only part of the work. That is why inventory management and truck stock belong in the productivity conversation, and why parts availability is a scheduling input and not only a purchasing one.
Stocking by job type and checking the right tools are on the truck before dispatch both help. We state no effect size for them. No named source supports a figure, so we give no number.
Read the callback figure with care. A technician with a high callback count may be the one taking the hardest jobs. Look at callbacks beside job type before drawing a conclusion about the person, or you will penalize your best diagnostician.
Callbacks and missing parts quietly cut efficiency, because the same job takes two visits and one is often unpaid.
Why a high number can still lose money
Productivity ratios say nothing about margin, so you can improve a number and still lose money.
A technician with high utilization and efficiency can still hurt profitability if the work is underpriced or the job mix is low-margin. Our audit methodology checks profit margins by job type next to the productivity ratios. A full day of billable hours on a low-margin job type is full, not profitable.
Rushing is the other trap. It lifts efficiency and can lower customer satisfaction and customer loyalty through callbacks and a poor service experience. Pair the ratios with a measure of the customer experience, such as repeat-visit rate or a short post-job survey. This follows from how the metrics are defined, and we cite no figure for it.
Customer demand shapes the numbers too. In a slow week, utilization falls whatever the technician does, because the booked work was not there. Read the figure against booked work before judging the person.
Services also differ in how much of an hour can be billed. An install and a diagnostic service call do not bill the same way. Compare like-for-like work, or the ratio will tell you more about the job mix than about the technician.
Productivity ratios say nothing about margin, so you can improve a number and still lose money.
How to track it without buying a dashboard first
You can run a monthly routine from your own job records, and software helps only once the routine already works.
Start with a spreadsheet with one row per technician per week. Columns: hours worked, billable hours, hours billed against actual, callbacks and revenue. Review it every month. Our audit methodology starts here because every cell can be checked against a timesheet or an invoice.
Headcount changes the method. With a few technicians, read each job and you will learn more than any ratio shows. With many, segment by trade or job type and look at the outliers. Segmentation keeps the comparison fair as the shop grows.
Real-time dashboards in field-service software can pull the same data automatically. They save effort. They do not make the metric more correct. Check the software's own definition of utilization against each vendor's documentation before trusting its number, because vendors define the terms differently and yours may not match theirs.
Pick one metric to act on first. A useful number points to a specific cause, whether drive time, callbacks or parts, that you can change this month. Data across technicians is useful only if the definitions are the same for every row.
Keep the review comparable by using the same teams and job categories each month, so trends mean something. Work on the cause rather than the person, and change one cause at a time. Changing three things at once leaves you unable to tell which one moved the number.
The question behind all of it is how well your shop uses the paid day. The ratios exist to answer that, and a spreadsheet can answer it before any software purchase.
You can run a monthly routine from your own job records, and software helps only once the routine already works.
How to track technician efficiency?
Record two figures for each job: the hours the work was expected to take, or the hours billed, and the hours actually spent. Do that per technician, divide the first by the second, and review the result monthly and by job type.
Use the same timekeeping for everyone, including how drive time is logged. If one technician logs drive time as job time and another does not, the comparison between technicians is not valid.
How is tech efficiency calculated?
Efficiency is expected or billed hours divided by actual hours spent.
In the hypothetical week above, the jobs were expected to take 24 hours and took 28, so efficiency is 24 divided by 28, or about 86 percent. Say which of the two common versions your shop uses, flat-rate billed hours or estimated hours, since they give different results for the same job.
How do I calculate productivity and efficiency?
Calculate utilization, efficiency and revenue per hour for each technician from the same week of records, then read them together.
Productivity is the revenue the hour earned, and efficiency is the speed of the work. Neither says anything about margin on its own.
How to increase technician productivity?
Find where the unbilled hours go first, whether drive time, idle time, callbacks or waiting on parts, and fix the largest cause.
Most of these are dispatch, stocking or pricing decisions, not effort. We promise no percentage gain, because we have no sourced result to put a number on.
Key Takeaways
Technician productivity is three ratios: utilization (billable hours over hours worked), efficiency (expected or billed hours over actual hours) and revenue per technician hour. Each answers a different question.
Calculate them per technician before averaging, and compare like-for-like work.
Most of the gap between paid and billable hours is drive time, idle time, callbacks and missing parts, which are dispatch and stocking decisions.
A high efficiency number can still lose money if the work is underpriced, so read it beside profit margin by job type.
A spreadsheet reviewed monthly is enough to start. A dashboard saves effort but does not make the definition correct.
Reading the numbers honestly, and where an audit fits
The ratios show where hours go, not why. Whoever sells you a fix before diagnosing the cause is selling a pitch, and a sales pitch is not a diagnosis. A utilization figure of 70 percent tells you hours are missing. It does not tell you whether the board, the truck stock or the pricing took them.
Anchorfield's audit is a method for finding where a $2-20M home services business loses hours and margin. Its scope is stated on the /method page. We have not yet delivered an audit to a home services company, so we state no finding from one here. We have built ERP software for an import business, a more complex operation than a home services company, so reading a business's records end to end is not new to us.
You may not need one. If you can already calculate the three ratios per technician and trace the gap to causes, you have done the work.
The ratios show where hours go, not why.
You already know something is wrong.
Ninety seconds will tell you how big it usually is.